In this article, the common techniques used by neuroscientists to record or view neural activity will be discussed. Some techniques allow for data from single cells to be recorded and analyzed. Other techniques provide information about which area of the brain is activated. In a separate article, we will discuss molecular imaging neuroscience techniques including 2-photon microscopy, connectomics, brainbow, and clarity.
Here Are the Current Neuroscience Techniques to Study Neurons
1. Intracellular Recordings
What do squids and electric currents have in common? Electrophysiology, the field dedicated to studying the electric properties of biological tissues, relies on recording devices to understand electric currents, or the flow of charged ions, in the neuron. The field first began to use intracellular recordings in 1947. Kenneth Cole and George Marmont developed a technique to measure the intracellular (or within the cell) movement of ions in and out of the cell membrane using two electrodes. To do this, the researchers needed a long axon (or nerve fiber that projects out of the neuron and transmits electric current). The squid became the candidate to study these currents due to its neurons having long axons. These long axons enable squid to escape rapidly in the presence of danger and travel through water in one movement. Together, Cole and Marmont had a system to study graded voltage changes over time.
In the cell membrane, there are many kinds of ions with both positive and negative charges at different levels of concentration. Outside of the membrane, there exists these same ions at either higher or lower volumes. Therefore, if there were holes in the membrane, some ions would flow out, while others would flow in due to molecular diffusion across the concentration gradient. Other mechanisms move ions against the gradient and flow of ions but require energy from the cell in the form of certain organic compounds. Using this property of diffusion, however, we could record the change of ion movement with an intracellular recording.
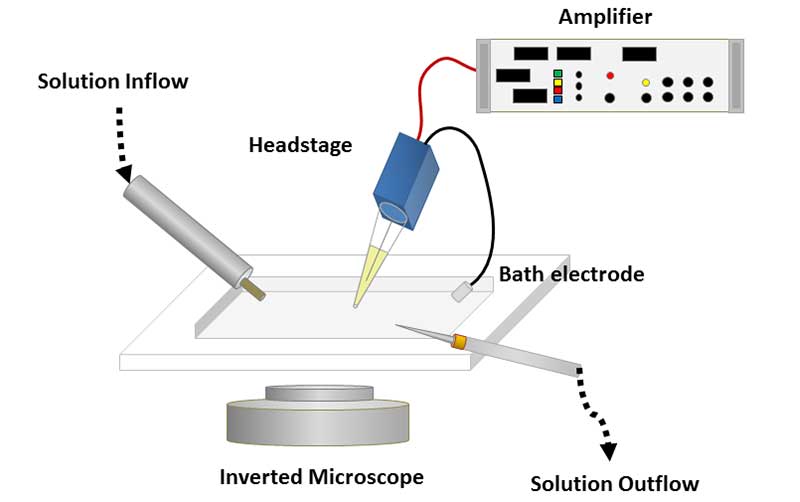
Intracellular recordings require glass micropipettes (sometimes called microelectrodes) since glass does not conduct electric current and decreases noise during signal detection. These pipettes are filled with electrolyte medium and inserted through the cell membrane. One recording electrode will be in the cell, while another will be out of the cell. This set up allows for the comparison between the two voltage levels (or the number of ions present near the pipette). A great benefit to using intracellular recordings is that these pipettes can measure small changes to the ion levels, below the threshold or level of creating an action potential or spike. An action potential is created when the inside of a cell reaches a certain voltage level that then opens more places in the membrane to create ion flow.
There are multiple setups for intracellular recordings including current injection techniques and voltage clamping. If we were interested in mimicking a current created by an input into the cell (such as another cell), we could inject certain currents into the cell or flood the intracellular fluid with ions to simulate this input. Meanwhile, if we wanted to study the changes in current at a fixed voltage, such as the case in understanding what level of graded length and amplitude of ion flow from a single ion, such as potassium (K+) or sodium (Na+), we would use a voltage clamp. It is important to note that injecting a current and fixing the voltage are two different concepts. Here’s an article on the uses of each.
Further development on the intracellular recording technique now lets us record intracellular dynamics during normal animal behavior and in conjunction with multiple other techniques to study both the contributions of certain ions during responses to stimuli, or object and things in the outside world, and the population level activity of multiple neurons working together. Other techniques have since been used due to their abilities to study local sites of ion movement (at ion channels, discussed further in the patch clamp technique) and record from multiple cells at once. Here is a good resource that talks about the setup in more detail:
2. Patch Clamp Technique
Imagine that you are at a birthday party, and you are handed a helium balloon. A helium balloon floats because helium is lighter, or less dense, than the particles that make up air, such as oxygen. However, when you return from the party, you notice that the balloon has deflated. Over time, these helium particles tend to pass through the balloon and oxygen particles take their place. Like the balloon, the plasma membrane allows for ions to flow in and out of neurons to generate electrical signals across the length of the neuron.
To accomplish the ability for ions to flow, the membrane maintains concentration gradients for specific ions and permits proteins, or ion channels, to move these ions across the membrane. To understand the generation and propagation of electrical signals along the neuronal membrane, it is important to measure the contribution of the current flow of ions for a given ion channel.
Prior to the invention of the patch clamp, Hodgkin and Huxley used the voltage clamp to understand how ion permeability contributes to inward and outward currents in the cell. With the technique, Hodgkin and Huxley studied Na+ and K+ movement across the neuronal membrane during the propagation of electrical signals. However, the voltage clamp has its limits. It is not possible to measure the current flow—or the number of ions moving across the membrane over time—for a specific ion channel with the voltage clamp. Rather, we can only measure the total current from the flow of ions across many different channels with this technique.
In 1976 at the Max Plank Institute, Erwin Neher and Bert Sakmann created the patch clamp technique to solve this issue. The patch clamp method has multiple configurations such as the cell-attached recording. To prepare this recording, a glass recording pipette filled with electrolyte solution contacts a small area, or patch, of the neuronal membrane. Next, a cell is prepared either in vitro (outside the model organism) or in vivo (inside the model organism) in a petrie dish filled with recording solution (made from a mixture of salts, glucose, and buffers). Slight suction is applied to this pipette to form a tight seal between the pipette opening and the membrane of the cell. This seal allows for ion flow through a single ion channel into the recording pipette.
There are some channels that permit ion flow in one direction against the membrane. Other configurations (such as the whole-cell recording, inside-out recording, and outside-out recording) of the patch clamp can record the ion flow of these special channels and other cases of ion permeability. Each of the configurations relates to the red balloon analogy. (Note: a patch clamp requires one point of flow, or ion channel, and a tight seal from the cell membrane to work. Sadly, it is not actually possible to form this seal using balloon plastic.) If you want to record the flow of helium out of the balloon through a small hole in the balloon, you can do a cell-attached recording setup. Now if you were interested in the total movement of ions in the entire balloon, you could use the whole-cell recording configuration. What about other kinds of air molecules in a balloon-like nitrogen? If you were interested in changing the inner contents of the balloon from helium to nitrogen and record the flow of these molecules through the balloon’s plastic, you could use inside-out recordings. Lastly, you may want to know if there flow of oxygen into the balloon. In this final case, you would use an outside-out recording method. Altogether, we can get a better sense of movement of particles (or in the case of the neuron, ions) across channels of the cell membrane! Together, the configuration of the patch clamp changes depending on the research question. The following YouTube video shows the technique, recordings, and other configurations of the method.
It is important to keep in mind that patch clamping cannot always tell us the whole story and requires training to implement this technique. When used incorrectly, the tight seal between the pipette and the membrane cannot be created; therefore, the patch clamp may record leaky currents. Further, the manual preparation time is long, so it is only possible to record the changes of certain compounds at one time. Here is a research article about protocols involved in preparing a cell for patch clamping, patching a cell, and setting up a recording:
3. Single Spike Recordings Single Electrodes or Utah Arrays
Ions can flow across the neuronal membrane. As a result, it is possible to record the changes in extracellular current from these ions using electrodes, or materials that conduct voltage changes. In 1957, Hubel developed the first of these electrodes by insulating thin stainless-steel wires. The tips of these wires conduct electric currents from outside of the neuron in an extracellular fluid to a recording system. In the brain, an electrode wire must record from the range of tens of uV. Also, extracellular currents tend to have smaller voltage amplitudes than intracellular recordings. Therefore, it is necessary to use an amplifier to more easily record and analyze these signals.
As a result of this technique, Hubel could record neuronal action potentials, or moments of voltage discharge from neurons, in the visual cortex. The voltage discharge positively and rapidly increases on the order of milliseconds in the extracellular matrix. This sudden increase of voltage resembles a ‘spike,’ hence the name single-spike recordings. Since the use of electrodes in the 1950s, the field of single-spike recordings has grown rapidly.
There are many benefits to using electrodes for recording neural data. Electrodes have high temporal acuity, like patch clamping. Unlike patch clamping, however, it can record in vivo voltage changes across days, if the electrode is chronically implanted and secured in the brain of a living, freely moving animal model. These implants do not limit behavior. In fact, clinicians use similar microelectrodes when finding the origin or locus of deep brain seizures in epileptic human patients. The high temporal resolution of electrodes (on the order of milliseconds) allows researchers to understand a single unit’s or neuron’s activity during animal behavior. The presentation of different stimuli or an external event can evoke a reaction at the neuronal or even behavioral level. For example, Hubel and Weisel recorded visual cortical cells during the presentation of light to the retina of an animal.
In specific orientations of light and locations on the retina, certain visual cortical cells fired more and increased their spiking. This experiment suggests that these neurons are interested in the orientation and location of visual information. Other applications include recording the activity of cortical neurons during motor movements, reward delivery, or navigation in space.
When certain neurons become more active in response to a stimulus in the environment, researchers may say that these cells “encode” information about this stimulus. Computational neuroscientists are interested in understanding how these neurons fire across time as a function of the presence of absence of these stimuli. There are multiple ways of representing this kind of information. A popular method is called the raster plot; this plot can help to visual the firing of spikes across time. Across different recording sessions of the same stimulus presentations (such as a chocolate food pellet), you will get multiple iterations of data from the same neuron or many neurons. When plotting a spike raster, time is represented on the x-axis and the iterations of recording (or trials) are represented on the y-axis. Therefore, if the food pellet was given to an animal at 500 ms, then certain neurons, such as dopamine neurons in the basal ganglia will change their activity during the presentation of the stimulus. The raster will show more spikes if neurons are more active during the time of stimulation, less spikes if the neurons are inhibited by the stimulus or decrease their firing, or no change in spikes if the neurons does not have a preference to (or is not modulated by) the stimulus. If you would like to try out working with a raster plot, read the reference and neural encoding. The video below shows how to plot multi-channel data using raster plots.
Since the invention and ubiquitous use of single-unit recordings from electrodes, there have been emerging technologies to record from more neurons. An example of new technology, the Utah array can record from many more cells than electrode wires. Utah arrays come in multiple configurations, including long probes that can record from a 10 mm distance, from deep structures like the thalamus or hippocampus. Other Utah arrays can take the shape of a microchip with multiple recording sites along the surface of the device to record better cortical information or cells near the surface of the brain. Here is a link to a research paper that talks about the advancements of electrode recordings in neuroscience over the span of decades. The youtube video below provides a good visual for these Utah arrays.
4. EEG
In the clinical setting, it is not always possible, or ethical, to use certain techniques due to invasive procedures. Therefore, electroencephalography, or EEG, is a great alternative to ensure minimal damage during neurosurgical procedures such as brain surgery mapping for deep brain stimulation implantation or location of damage from strokes. First discovered at the Montreal Neurological Institute, EEG helps expand our knowledge of the cortical structures of the human brain. For example, with this technique, it is possible to record from neural activity in the somatosensory cortex, motor cortex, and even language processing areas like Broca’s area. These areas reside near the surface of the brain, which makes the ability to record from this region easier. Despite its many uses in the clinical setting, EEG is limited by recording deep brain structures.
EEG, developed by Herbert Jasper and Wilder Penfield and originally invented by Hans Berger, uses similar technology to single-unit recording electrodes. However, the electrodes used in EEG are much larger and placed on top of the scalp using a cap. This configuration enables the recording of brain waves (the neural activity). Epileptic patients have fast, spiking brain waves during moments of seizure that can be visualized. Other patients, such as stroke patients, may have slower brain waves. Even during normal cycles of sleep, our EEG data can change. Sometimes, these brain waves are referred to as neural oscillation or brain rhythms.
It is also possible to record EEG data from electrodes recording population-level activity. Electrode recordings can be filtered into two frequency bandwidths. The higher frequency filter (~300 – 3000 Hz) removes high frequency signal and keeps low frequency signal and letting it “pass through,” hence the name low-pass filter. Meanwhile, the lower frequency filter (<300 Hz) removes low frequency signal from high frequency information, yielding high frequency signal. The high frequency signal tends to contain single unit spikes, while the low frequency signal contains population-level EEG signal. In this frequency range, it is possible to see when groups of neurons fire simultaneously. We refer to this signal as the local field potential.
Neural oscillations are categorized into multiple wave types, including but not limited to sleep spindles, alpha, beta, gamma, and theta waves. One such wave, called the theta wave, correlates with animal motor behavior and REM sleep. Theta can be observed in the hippocampus and has been implicated in theories on navigation and memory organization. Certain factors such as the speed of the animal can modulate the level or power of theta rhythms. Brain states, such as sleep versus awake states or satiated versus hungry states, also modulate theta waves. On a biochemical level, certain molecules such as acetylcholine, which is released during learning and motor responses, correlate with the presence of theta waves. Together, there are many factors that contribute to the changes across and within types of neural oscillations.
When invasive EEG is performed in the clinical setting intracranially, it is called electrocorticography (ECoG). Although it is possible to record EEG signal from the skull surface, ECoG allows for cortical mapping during surgery with less noise (higher signal-to-noise ratio). In some neural procedures, patients are alert for the mapping procedures to test language, reading, speech, and somatosensory processing. ECog may also rely on the use of Utah arrays in some settings. After ECog, clinicians decide whether a patient requires a resectioning or lesion surgery to prevent further, more damaging seizures from damaging brain tissue. The video below provides an intro into EEG recordings.
5. fMRI
Functional magnetic resonance imaging (fMRI) can record from the whole brain and is readily used in the clinical setting. Like EEG, it can be noninvasive and help diagnose certain conditions such as stroke, dementia, and traumatic brain injury. fMRI relies on the flow of blood to record images across time. The idea of blood flowing more into the brain during neural activity was first introduced during the late 1800’s by Angelo Mosso. In these studies, subjects laid down on a balance and performed math problems. As more math problems were solved, the balance would tip towards the subject’s head. What was the conclusion of this test? That the brain required more blood flow as it worked harder. Now all that was needed was a machine to record blood flow to specific regions of the brain.
In blood, proteins called hemoglobin have a magnetic property that changes depending on the level of oxygen bound to it. Brain areas that require more energy also require more oxygen. The presence and absence of oxygen on hemoglobin changes the magnetic properties of blood. Therefore, the change in oxygen concentration in the blood can be captured by strong magnets. Hemoglobin without any oxygen (or dHB) is more magnetic than hemoglobin with oxygen. The more magnetic form of hemoglobin can distort magnetic fields generated in the fMRI scanner. To understand magnetic fields in the brain more, see MEG. Unfortunately, it is not possible to record from single neurons during fMRI, since BOLD has low temporal resolution and hemodynamic responses occur on the order of seconds, however, BOLD imaging has great spatial acuity.
Two prominent ways to perform BOLD-fMRI studies include region of interest (ROI) analysis and voxel-wise analysis. ROI analysis should be done if the research question is exploratory or in comparison to a baseline scan (without a task involved for the subject). A voxel-based analysis is better at modeling the differences in brain anatomy or brain concentration. Before applying these analyses, however, it is important to preprocess the data. The steps of preprocessing the data include estimating and subtracting head motion artifacts to align images across the brain from the jaw to the top of the head, creating a reference brain to normalize the images to a certain shape, and correcting slice-timing to prevent drift of movement or images. A new pipeline, called fMRIPrep can help with automating these stages. After processing the data, it is possible to see activation across images of the brain as shown here.
There are multiple other magnetic resonance imaging scanners that can measure other responses such as white matter anatomy to learn about the connectivity of different brain regions. Another type of scan records the fluid movement in the brain to understand cranial spinal fluid buildup and flow. These types of MRI act similarly to fMRI but require separate imaging parameters to capture the magnetic fields of different brain matter types.
6. Magnetoencephalography MEG
Magnetoencephalography (MEG) provides similar capabilities to EEG in the clinical setting. Unlike EEG, however, MEG measures magnetic fields rather than electrical fields. MEG is commonly used to measure the spontaneous activity of the brain or neural response to task-based stimuli in the experimental setting. Similar to EEG and electrode arrays, MEG provides an alternative to finding epileptic loci. MEG has a high temporal resolution, but poor spatial resolution. Therefore, we cannot record from the whole brain with MEG. Simultaneous MEG and fMRI recordings can strengthen each other’s limitations. For example, MEG cannot record from deep brain regions, while fMRI can record from areas like the amygdala, basal ganglia, and hippocampus. fMRI cannot record samples at a fast rate, so the use of MEG aids in mapping activation from different areas on a finer timescale.
To record from MEG information, subjects must wear a headcap with superconducting quantum interference devices (SQUIDs) before being placed in a scanner. In the biomagnetometer scanner, these devices amplify neural information. Further amplification of signal can be done on supercomputers. Although the scanner relies on recording magnetic fields, it is not harmful to patients and does not emit magnetic fields or radiation. Here is a video of a MEG procedure.
How does MEG work? As an electrical current is generated by neurons, the current also produces a small magnetic field. Maxwell’s equations prove that any electrical current also generates a magnetic current. Let’s take a simple electrical current as an example to conceptualize magnetics fields: a laptop charging cable. The cable has a positive charge flowing in one direction and a negative charge flowing in the opposite direction. The current from this cable causes electrons to spin. If the spinning from two sets of electrons from the positive and negative charge directions are equal, they will not create a magnetic current. However, if they are not the same, a magnetic field is generated. The brain emits small magnetic fields since the directionality of the current flow and electrical movement of both positive and negative charges are not always equal. SQUIDs detect these small magnetic fields. These sensors can detect magnetic fields since the material is made of ferrous or magnetic metals. There are limitations when using SQUIDs. The experiment room requires a lot of shielding from other magnetic fields outside of the brain.
To understand data from MEG, we can employ analyses similar to fMRI analyses. First, the data must be processed to remove artifacts or noise caused by muscle movements, heart pulses, or blinking. This can be done by signal processing (or bandpass filters) such as subtracting a certain frequency of signal or using a clustering technique called independent component analysis. Once the data is processed, we are left with the extracted waveforms from the recording. Equivalent current dipole (ECD) modeling localizes the source of certain information such as seizures. This analysis involves the extraction of peaks in the waveforms and superimposing the signal on each SQUID channel to plot the amplitude and first peak across the topographical map of the subject’s head. Altogether, MEG acts as a great tool for clinicians and researchers working with humans and non-human primates.
7. Neuromorphic Engineering & Computer Chips
With applications of neuroscience readily growing and the use of machine learning and other artificial intelligence algorithms in the field, neuromorphic engineering aims to make computers and machines more efficient by emulating the way a brain processes information. Current neuromorphic computing research focuses on modeling how systems and multiple brain regions fire together. Neuromorphic engineering is a relatively new field. Multiple projects today focus on creating digital versions of the neural system.
One of the first large-scale projects to make a neuromorphic chip was the DARPA SyNAPSE project. The result was the IBM TrueNorth chip which was built in 2014. It has a scalable design where one core had 256 programable simulated neurons and each chip has 4096 cores. The video below is the program director talking about what was involved in building the chip.
This next video talks about the applications of the TrueNorth chip.
Some of these projects include creating faster computer chips, brain maps across neuronal connections, and brain-machine interfaces between the brain and the digital world. Intel, a computer manufacturing and research company is working on a computer chip called “Loihi” to act as a self-learning neuromorphic technology. This research group aims to use models or spiking neural networks, to simulate learning and remapping of synapses (or connections) between neurons. By creating a silicon computer chip that uses spiking neural networks, the chip can learn to make new connections to decrease processing speeds and increase the amount of information transmitted. This video gives an overview of the Loihi chip design.
Other projects, such as the Blue Brain Project, are working to create a digital mouse brain. With the complete anatomy of the mouse brain, we could simulate different responses without needing to use an animal model. These simulations also rely on machine learning. These tools would make a significant impact on the field, but there are limitations to this project. Currently, we cannot map all details of the biological brain, such as the genes, proteins, and neurodevelopmental steps involved in sustaining a brain. Thus, by starting on modeling the morphology of the mouse brain, it is possible to reconstruct the whole brain for different organisms.

Pel is a Neuroscience Ph.D. Candidate at the Johns Hopkins University School of Medicine.